A Short Course on Sound and Human Hearing
Jed Margolin
Index
A-Weighting versus C-Weighting
Fletcher Munson Updated Curves
One Third Octave-Band Center Frequency Chart
Comparison of A-Weighting and B-Weighting at Low Frequencies
The dB (decibel) is a logarithmic unit for comparing two measurable quantities whose ratios may range from very large to very small.
It is similar to the Richter Scale where each whole number step in the magnitude scale corresponds to the release of about 31 times more energy than the amount associated with the preceding whole number value.
For Sound Pressure, dB = 20 * log10 (Pressure 2/Pressure 1)
Deci-Bel literally means 1/10 of a Bel. Deci comes from the Latin “decimus” meaning “tenth”. The Bel is considered too large to be useful so it is divided by ten. Technically, when used in Sound Pressure comparisons, it should be called something else because it is a twentieth, not a tenth. (Life is full of inconsistencies, ranging from very large to very small.)
Bel is capitalized because the unit is named to honor Alexander Graham Bell.
By itself, dB does not indicate an actual sound pressure, only a relative sound pressure. In order for dB to indicate an actual sound pressure it must be referenced to an actual sound pressure.
The standard that is used for sound pressure is 20 uPa (20 micro Pascals). “Pascal” is capitalized because it is named to honor Blaise Pascal, a 17th century French mathematician, physicist, inventor, writer, and philosopher. He made important contributions to the study of fluids and clarified the concepts of pressure and vacuum by generalizing the work of Evangelista Torricelli. Torricelli (who invented the barometer) also has a unit of measure named after him, the Torr.
A Pascal is a
In order to indicate that the dB is referenced to this actual acoustic pressure it is called “db Acoustic” which may be shortened to either “dBA” or “dB(A)”. For various reasons I prefer “dBA.”
A sound pressure of 20 uPA is 0 dBA. This is because log10(1) = 0. Remember that 10 to the zero power (100) = 1, not zero . And 20 times 0 = 0.
A sound pressure of 0 dBA is the softest sound that a human with normal hearing can detect under laboratory conditions, which is probably why it was chosen as the reference.
The following useful information comes
from the consulting firm of Jones & Stokes Associates by way of the
California State Water California State Water Resources Control Board, General Waste
Discharge Requirements for
Most
people have difficulty distinguishing the louder of two sound sources if they
differ by less than 1.5-2.0 dB. Research into the human perception of changes in
sound level indicates the following:
- a 3-dB change is just perceptible,
- a 5-dB change is clearly perceptible, and
- a
10-dB change is perceived as being twice or half as loud.
Here is a chart from Appendix G (cited above) showing various sounds levels in dBA and what they correspond to.
If you have a sound at 60 dBA and add another sound that (separately) is also 60 dBA the result is not 120 dBA.
That is because the dB comes from a logarithm. You have to convert the two dBAs back into their respective sound pressures, add the sound pressures, and convert the result back into dBA.
Here is a chart from http://www.engineeringtoolbox.com/adding-decibel-d_63.html
|
Sound Power
Level Difference between two Sound Sources (dB) |
Added Decibel
to the Highest Sound Power Level (dB) |
|
0 |
3 |
|
1 |
2.5 |
|
2 |
2 |
|
3 |
2 |
|
4 |
1.5 |
|
5 |
1 |
|
6 |
1 |
|
7 |
1 |
|
8 |
0.5 |
|
9 |
0.5 |
|
10 |
0.5 |
|
> 10 |
0 |
|
|
|
Here is my own concrete example:
|
Sound 1 (separate) dBA |
Sound 2 (separate) dBA |
Resulting dBA |
|
60 |
60 |
63 |
|
60 |
61 |
63.5 |
|
60 |
62 |
64 |
|
60 |
63 |
65 |
|
60 |
64 |
65.5 |
|
60 |
65 |
66 |
|
60 |
66 |
67 |
|
60 |
67 |
68 |
|
60 |
68 |
68.5 |
|
60 |
69 |
69.5 |
|
60 |
70 |
70.5 |
Above 70 dBA for Sound 2 add nothing.
Another way of looking at it is:
|
Sound 1 (separate) dBA |
Sound 2 (separate) dBA |
Resulting dBA |
|
60 |
60 |
63 |
|
60 |
59 |
62.5 |
|
60 |
58 |
62 |
|
60 |
57 |
62 |
|
60 |
56 |
61.5 |
|
60 |
55 |
61 |
|
60 |
54 |
61 |
|
60 |
53 |
61 |
|
60 |
52 |
60.5 |
|
60 |
51 |
60.5 |
|
60 |
50 |
60.5 |
Below 50 dBA for Sound 2 the result is 60 dBA (just Sound 1).
A-Weighting versus C-Weighting
In the 1920s (and maybe 1930s) Harvey Fletcher and W.A. Munson of Bell Laboratories did tests to determine the frequency response of human hearing. Their results were published in the article “Loudness, its definition, measurement and calculation" in the Journal of the Acoustical Society of America 5, 82-108 (1933). [Ref 2]
They used a pure tone at 1 KHz as a reference. Then they played a pure tone at another frequency and asked the test subject if the second tone was louder than the first tone, softer than the first tone, or the same loudness. If the second tone was either louder or softer than the first tone they adjusted the loudness of second tone and repeated the test until it was reported as being the same loudness.
The amount they had to boost the second tone to be the same loudness as the first tone (the 1 KHz reference) meant the human ear was less sensitive at that frequency by the same amount.
Then they repeated the test with pairs of tones (one of them the 1 KHz reference) until they had covered the spectrum they wanted to cover.
They discovered that the human ear is less sensitive at low frequencies and at high frequencies. They produced a curve of the human ear’s frequency response.
It sounds simple but it isn’t.
When they did the test at different sound levels they got different curves.
When you look at the following set of curves remember that when the curve goes up it meant they had to boost the sound to make it sound as loud as it did at 1 KHz.
Look at the curve for 40 dBA. Find 30 Hz. It is the line immediately to the right of 20 Hz.
In order for 30 Hz to be the same loudness as 1 KHz it had to be boosted to almost 80 dBA, for a difference of almost 40 dB. It means that the ear is 40 dB less sensitive at 30 Hz than it is at 1 KHz.
Now look at the curve for 70 dBA. In order for 30 Hz to be as loud as 1 KHz it only had to be boosted to about 83 dBA for a difference of 13 dB. Therefore, at 70 dBA the ear is only 13 dB less sensitive at 30 Hz than it is at a sound level of 40 dBA.
This is why most stereos have a Loudness switch. When you are listening at low sound levels the Loudness switch boosts the bass.
Look at the curve for 100 dBA. The low frequencies don’t need any boost at all. At 100 dBA the ear’s frequency response is essentially flat from 30 Hz to 1 KHz. Then there is a boost in sensitivity between 1 KHz and 6 KHz. (The frequency scale is a log scale.)
Don’t try this at home. 100 dBA is the sound of a pile driver at 50 feet or an ambulance siren at 100 feet.
After Fletcher and Munson published their work the manufacturers of sound level meters incorporated filters into their sound level meters to approximate the Fletcher Munson curves so that their sound level meters would report the loudness levels that humans heard.
The sound level meter manufacturers incorporated filters for only two curves: the curve at 40 dBA and the curve at 70 dBA.
The 40 dBA curve was called A-Weighting. The 70 dBA curve was called B-Weighting. When the meter was operated with a flat frequency response (no filter) it was called C-Weighting.
The curves have not changed much since then except that sound meter manufacturers have dropped B-Weighting.
Why did they do that? Did they think that all sound environments that one would like to measure were at 40 dBA?
The result is that if you use A-Weighting in an environment of 70 dBA you will under-report a 30 Hz sound by 27 dB. (40 dB at 40 dBA for A-Weighting versus 13 dB at 70 dBA for B-Weighting)
27 dB is perceived as more than four times as loud. (The first 10 dB is twice as loud. The second 10 dB is again twice as loud. The next 7 dB is only a little louder.)
Most (maybe all) modern professional sound level meters probably use digital signal processing to synthesize the filters. If they used a Fast Fourier Transform (FFT) [which is used to make spectrum analyzers] they could make a sound level meter that applies the correct weight to each sound component at each frequency at each amplitude.
There are things about the Fletcher and Munson methodology to criticize. These criticisms also apply to those who have duplicated and updated the Fletcher and Munson curves.
1. They used headphones. (Fletcher and Munson called them “head receivers”.) Although there are substantial difficulties creating a calibrated sound field using speakers, most people experience the world in free-air sound. And if I am being subjected to annoying and distracting sound through headphones I can take the headphones off.
2. They used pure tones. Random noise is
generally perceived as louder than a single tone at the same sound pressure
level, regardless of the weighting. See Eberhard Zwicker, “Meaningful Noise Measurement and Effective Noise
Reduction”, Noise Control Eng. J., 29(3), pp.
66-76 (1987) as cited in The Impact of A-weighting Sound Pressure Level Measurements
during the Evaluation of Noise Exposure, Richard L. St. Pierre, Jr. and
Daniel J. Maguire, NOISE-CON 2004, 2004 July 12-14, Baltimore, Maryland. [Ref 3] The Pierre and
Maguire paper is very much worth reading.
Why is the use of A-weighting so prevalent that it is
routinely specified by municipalities in their noise ordinances?
From The OSHA Technical Manual Noise and Hearing
Conservation, Appendix I:A Physics of Sound) [Ref 4]
It has been found that the A-network gives a better estimation of the threat to human hearing than the other networks. The A-network is required by OSHA for measuring noise in the workplace and is widely used in describing occupational and environmental noise.
They think that if OSHA uses it, they are safe from legal
challenge.
Applying the OSHA standard is wrong for at least five
reasons:
1. OSHA uses it to protect workers from
measurable and permanent hearing damage. They do not consider other
physiological and psychological effects caused by exposure to noise.
2. The adoption of A-weighting was a
bureaucratic decision made for the benefit of the companies who create the noise
that their workers are subjected to. Reducing noise levels costs money.
3. People living in their homes are not workers
who, apparently, can quit their jobs and easily find another, less noisier,
one.
4. Workers are not supposed to sleep on the
job.
5. Their statement that “It has been found that the A-network gives a better estimation of the threat to human hearing than the other networks” has no foundation.
You will often see the Fletcher Munson curves referred to by a phon number.
Here is the deal on phons from http://hyperphysics.phy-astr.gsu.edu/hbase/sound/phon.html
Saying that two sounds have equal intensity is not the same thing as saying that they have equal loudness. Since the human hearing sensitivity varies with frequency, it is useful to plot equal loudness curves which show that variation for the average human ear. If 1000 Hz is chosen as a standard frequency, then each equal loudness curve can be referenced to the decibel level at 1000 Hz. This is the basis for the measurement of loudness in phons. If a given sound is perceived to be as loud as a 60 dB sound at 1000 Hz, then it is said to have a loudness of 60 phons.
Therefore, a 40 dBA tone at 1 KHz is 40 phons.
Fletcher Munson Updated Curves
Attempts have been made periodically to update the Fletcher Munson curves. Some have been more successful than others. The history of these attempts will not be covered here.
The following curves appear to be current. They come from the Federal Highway Administration. [Ref 5]
http://www.fhwa.dot.gov/environment/noise/measurement/mhrn03.cfm
Note that they go down to 20 Hz while the original Fletcher Munson curves only went down to slightly below 30 Hz. If you read the original Fletcher Munson paper they use the frequency unit “cycles per second.” This was changed to Hertz (Hz.) in the 1960s. It honors Heinrich Hertz, the German physicist who clarified and expanded the electromagnetic theory of light that had been put forth by the British physicist James Clerk Maxwell in 1884. In the 1880s Hertz proved that electricity can be transmitted in electromagnetic waves which travel at the speed of light and which possess many other properties of light. His experiments with these electromagnetic waves led to the development of the wireless telegraph and the radio.
Curves from the
What follows is a One Third Octave-Band
Center Frequency Chart, also from the Federal Highway Administration.
One Third Octave-Band Center Frequency Chart
These are not dBA because they are not referenced to the Acoustic sound pressure standard of 20 uPA (20 micro Pascals). They are referenced to 1 KHz, where A-Weighting, B-Weighting, and C-Weighting would all read the same.
|
One Third Octave-Band Center
Frequency |
A (dB) |
B (dB) |
C (dB) |
|
20 |
-50.4 |
-24.2 |
-6.2 |
|
25 |
-44.8 |
-20.5 |
-4.4 |
|
31.5 |
-39.5 |
-17.1 |
-3 |
|
40 |
-34.5 |
-17.1 |
-2 |
|
50 |
-30.3 |
-11.6 |
-1.3 |
|
63 |
-26.2 |
-9.4 |
-0.8 |
|
80 |
-22.4 |
-7.3 |
-0.5 |
|
100 |
-19.1 |
-5.6 |
-0.3 |
|
125 |
-16.2 |
-4.2 |
-0.2 |
|
160 |
-13.2 |
-2.9 |
-0.1 |
|
200 |
-10.8 |
-2 |
0 |
|
250 |
-8.7 |
-1.4 |
0 |
|
315 |
-6.6 |
-0.9 |
0 |
|
400 |
-4.8 |
-0.5 |
0 |
|
500 |
-3.2 |
-0.3 |
0 |
|
630 |
-1.9 |
-0.1 |
0 |
|
800 |
-0.8 |
0 |
0 |
|
1000 |
0 |
0 |
0 |
|
1250 |
0.6 |
0 |
0 |
|
1600 |
1 |
0 |
-0.1 |
|
2000 |
1.2 |
-0.1 |
-0.2 |
|
2500 |
1.3 |
-0.2 |
-0.3 |
|
3150 |
1.2 |
-0.4 |
-0.5 |
|
4000 |
1 |
-0.7 |
-0.8 |
|
5000 |
0.6 |
-1.2 |
-1.3 |
|
6300 |
-0.1 |
-1.9 |
-2 |
|
8000 |
-1.1 |
-2.9 |
-3 |
|
10000 |
-2.5 |
-4.3 |
-4.4 |
|
12500 |
-4.3 |
-6.1 |
-6.2 |
|
16000 |
-6.7 |
-8.5 |
-8.6 |
|
20000 |
-9.3 |
-11.2 |
-11.3 |
Comparison of A-Weighting and B-Weighting at Low
Frequencies
The following table shows the A-Weighting curve and B-Weighting curve referenced to the C-Weighting Curve (which is why the C entries are all ‘0’). I produced this chart from the data supplied by the Federal Highway Administration.
A meter using A-Weighting or B-Weighting will read that number of dB lower than when using C-Weighting.
The difference between B-Weighting and A-Weighting means that A-Weighting will read that number of dB lower than B-Weighting would read.
|
Frequency (Hz) |
C (dB) (Reference) |
B (dB) |
A (dB) |
|
Difference (dB) Between B Scale and A Scale |
|
20 |
0 |
-18.0 |
-44.2 |
|
26.2 |
|
25 |
0 |
-16.1 |
-40.4 |
|
24.3 |
|
31.5 |
0 |
-14.1 |
-36.5 |
|
22.4 |
|
40 |
0 |
-15.1 |
-32.5 |
|
17.4 |
|
50 |
0 |
-10.3 |
-29.0 |
|
18.7 |
|
63 |
0 |
-8.6 |
-25.4 |
|
16.8 |
|
80 |
0 |
-6.8 |
-21.9 |
|
15.1 |
|
100 |
0 |
-5.3 |
-18.8 |
|
13.5 |
|
125 |
0 |
-4.0 |
-16.0 |
|
12.0 |
|
160 |
0 |
-2.8 |
-13.1 |
|
10.3 |
|
200 |
0 |
-2.0 |
-10.8 |
|
8.8 |
|
250 |
0 |
-1.4 |
-8.7 |
|
7.3 |
From: www.renzotonin.com.au/wizardsPDF/acousticTerminology.pdf
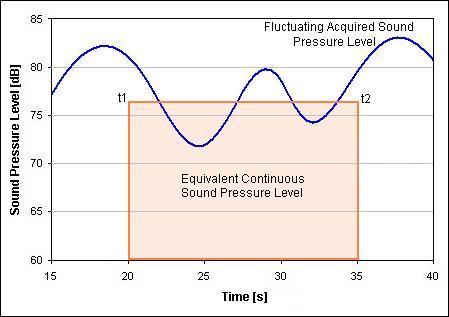
Leq Equivalent sound pressure level - the steady sound
level that, over a specified period
of time, would produce the same energy equivalence as the
fluctuating sound level
actually occurring.
Notice that this is about energy equivalence, not sound
pressure equivalence.
Leq is an RMS (Root Mean Squared) function of sound
pressure. You square each value, add up all the values, divide by the number of
values, and take the square root of the result.
From the Web site National Instruments: http://digital.ni.com/public.nsf/allkb/FCE0EC0A6B193A028625722E006DE298
Leq is a symbol that represents “Equivalent Continuous
Noise Level”. Usually the signal that you are measuring is varying in amplitude.
You can calculate the sound pressure (noise) level of an imaginary continuous
signal, within a given time interval, that would produce the same energy as the
fluctuating sound level that you are measuring.
The calculation is relatively simple; the Leq algorithm
just divides the integrated sound pressure by the total duration of the signal.
The result is expressed in dB.
· Leq = equivalent continuous sound pressure level [dB]
· p0 = reference pressure level = 20µPa
· pA= acquired sound pressure in Pa
· t1 = start time for measurement
· t2 = end time for measurement
Continuing from www.renzotonin.com.au/wizardsPDF/acousticTerminology.pdf
Leq(1hr) The Leq noise level for a specific one-hour
period.
Leq(8hr) The continuous noise level during any one hour
period between 10pm and 6am.
Leq(9hr) The Leq noise level for the period 10pm to
7am.
Leq(15hr) The Leq noise level for the period 7am to
10pm.
Leq (24hr) The equivalent continuous noise level during a
24 hour period, usually from midnight
to midnight.
There are also ways to specify the sound pressure level
that is exceeded for a specified percentage of time.
L1 The sound pressure level that is exceeded for 1% of the
time for which the given sound
is measured.
L10 The sound pressure level that is exceeded for 10% of
the time for which the given
sound is measured.
L10(1hr) The L10 level measured over a 1 hour period.
L10(18hr) The arithmetic average of the L10(1hr) levels for
the 18 hour period between 6am and 12 midnight on a normal working day. It was a
common traffic noise descriptor. For traffic noise it is usually about 3dB(A)
higher than Leq (24 hours).
L90 The level of noise exceeded for 90% of the time. The
bottom 10% of the sample is the L90 noise level expressed in units of dB(A).
Labels
Both dBA and A-Weighting contain an “A” and this causes considerable confusion in municipal codes and even in professional papers.
I have seen dBA used to mean both dB-Acoustic and dB-Acoustic, A-Weighting, sometimes in the same document. I have seen a proposed ordinance where sometimes dBA means dB-Acoustic and sometimes it means dB-Acoustic, A-Weighting. The proposed ordinance, which usually uses dB(A) to mean dB-Acoustic, contains a reference to dB(A) to mean dB-Acoustic, A-Weighting and dB(C) to mean dB-Acoustic, C-Weighting. Is this due to ignorance or is it intentional in order to cause confusion?
Note that dB-Acoustic does not mean dB-Acoustic, C-Weighting. dB-Acoustic, C-Weighting is flat only within its specified bandwidth. dB-Acoustic means a sound pressure referenced to 20 uPa. There is no curve, there is no bandwidth restriction. It is a naked sound pressure measurement.
As a result, it is necessary to explicitly define the terms in each document/code/ordinance/paper.
Here is how it can be done:
dBA means dB-Acoustic
dBA(A) means dB-Acoustic, A-Weighting
dBA(C) means dB-Acoustic, C-Weighting
dBA(F) means dB-Acoustic, Flat (within a specified bandwidth, such as the limits of an instrument)
dBA(Z) means dB-Acoustic, Z-Weighting
or it can be stated as:
dBA means dB-Acoustic
and then explicitly use the terms
dBA(A-Weighting)
dBA(C-Weighting)
dBA(Flat)
dBA(Z-Weighting)
Ordinances and Standards
Many ordinances specify ANSI or IEC standards for measuring sound. By specifying them in the ordinance, the ANSI and IEC standards have been incorporated into the ordinance.
The method used to measure a quantity defines the standard for that quantity. If the sound pressure level standard calls for sound pressure to be measured with a piece of string, then that defines the sound pressure level standard.
The ANSI and IEC standards are only available if you buy them. They cost too much.
For example, suppose an ordinance specifies the following:
1. All instruments must meet ANSI Type 1
performance specifications, and meet requirements of ANSI 1.4, 1.11, and
1.42.
2. Procedures must meet ANSI S12.9 and other applicable
ANSI standards.
Without seeing ANSI 1.4 there is no way to know what the required frequency range or accuracy for the instrument is. ANSI 1.4 costs $100.
ANSI S12.9 contains six parts. From the ANSI Web site:
ANSI S12. 9 - Part 1-1988 (R2003)
Quantities and Procedures for Description and Measurement of Environmental Sound, Part 1 $90
ANSI/ASA S12. 9-1992/Part 2 (R2008)
Quantities and Procedures for Description and Measurement of Environmental Sound, Part 2
Measurement of Long-Term, Wide-Area Sound $100
ANSI/ASA S12. 9-1993/Part 3 (R2008)
Quantities and Procedures for Description and Measurement of Environmental Sound, Part 3,
Short-Term Measurements with an Observer Present $100
ANSI S12. 9 - Part 4-2005
Quantities and Procedures for Description and Measurement of Environmental Sound - Part 4:
Noise Assessment and Prediction of Long-term Community Response $100
ANSI/ASA S12. 9/Part 5-2007
Quantities and Procedures for Description and Measurement of Environmental Sound - Part 5:
Sound Level Descriptors for
Determination of
ANSI/ASA S12. 9-2008/Part 6 Revises ANSI S12.9-Part 6-2000 (R2005)
Quantities and Procedures for Description and Measurement of Environmental Sound - Part 6:
Methods for Estimating of Awakenings Associated with Outdoor Noise Events Heard in Homes $110
If the only way people can read the standards is by buying them ($690) then the only way people can read the entire ordinance (and the most important part of the ordinance) is by spending $690.
As a result, important parts of the code
are secret to most of the people who are required to obey it (rich people
excepted). Aren’t Secret Laws still un-Constitutional in the
There are three categories of professional equipment.
Type 0: for Laboratories
Type 1: Measures down to 3 Hz.
Type 2: Measures down to 20 Hz.
Examples of Type
1 Meters
A good example of a Type 1 Sound Level Meter is the Sound Pro 1 by Quest Technologies.
It is available in several versions, including:
1. A version that just reads the broadband sound pressure level (Sound Pro 1 for $3,101)
http://www.coleparmer.com/catalog/product_view.asp?sku=5051061
2. A version that does octaves (Sound Pro 1/1 for $4,099)
http://www.coleparmer.com/catalog/product_view.asp?sku=5051062
3. A version that does 1/3 octaves (Sound Pro 1/3 at $5,038).
http://www.coleparmer.com/catalog/product_view.asp?sku=5051063
They have the following weighting functions: A, C, Z, F
C-Weighting is considered obsolete, replaced by
Z-Weighting. I have not found an explanation of Z-Weighting; perhaps it is in
the ANSI and IEC documents. It is probably the new Flat response.
Quest uses ‘F’ to mean Flat.
The above meters are rated to have the following accuracies:
? 0.1 dB down - 20 Hz to 14 kHz.
? 1.0 dB down - 5 Hz to 25.2 kHz.
? 3.0 dB down - 3 Hz to 25.8 kHz.
I talked to Melissa at Quest Technologies (1-800-245-0779).
When the meter needs to be recalibrated, it costs $520. (whew!)
There is additional software available for analyzing the data for $505.
I think it would be reasonable to expect that a Professional Acoustics Consultant would have equipment of this type.
Examples of Type
2 Meters
Quest makes a Type 2 meter that goes down to 20 Hz and costs $1,881 (SP-SE-2). http://www.coleparmer.com/catalog/product_view.asp?sku=5051058
The Protek SL1700 is a type 2 meter but only has a bandwidth of 31.5 Hz to 8 KHz. The quoted accuracy within this range is +/- 1.5 dB. The accuracy outside this range is not known. However, this meter has the advantage that it can be purchased for $162.00 .
See http://www.testequipmentdepot.com/protek/sound-level/sl1700.htm#0003023?ref=gbase
For $288 you can get the SL1701 which has a data logger and RS-232 interface.
Other
Radio Shack Model 33-4050 7-Range Analog Display Sound Level Meter. Cost: $44.99. It is listed as out of stock. It may have been discontinued.
It has a rated accuracy of +/- 2 dB at 114 dBSPL which is
useless even if dBSPL means dBA. It does not say what the accuracy is at lower
sound levels.
It has A-Weighting and C-Weighting. This is what the manual says:
• WEIGHTING A measures noise level. It primarily measures frequencies in the 500-10,000 Hz range, which is the area of greatest sensitivity to the human ear.
• WEIGHTING C measures sound level of musical material. It measures uniformly over the frequency range from 32-10,000 Hz.
This meter can be useful for comparing sound levels from different sources but should not be used for measuring absolute sound levels (dBA).
Radio Shack Model 33-2055 Digital-Display Sound-Level Meter. Cost: $49.99. It is also listed as out of stock.
It appears to be a digital version of the analog meter. The specifications are the same.
_____________________________________________________________________________________
[1] California State Water California State Water Resources Control Board, General Waste Discharge Requirements for Biosolids Land Application, Draft Statewide Program EIR, Appendix G, June 28, 1999. [click here]
[2] Loudness, its definition, measurement and calculation, Harvey Fletcher and W.A. Munson of Bell Laboratories, Journal of the Acoustical Society of America 5, 82-108 (1933). [click here]
[3] The Impact of A-weighting Sound Pressure Level Measurements
during the Evaluation of Noise Exposure, Richard L. St. Pierre, Jr. and Daniel J. Maguire,
NOISE-CON 2004, 2004 July 12-14, Baltimore, Maryland. [click here]
[4] OSHA Technical Manual Noise and Hearing Conservation, Appendix I:A Physics of Sound [click here]
(http://www.osha.gov/dts/osta/otm/noise/health_effects/physics.html)
[5] Measurement of Highway-Related Noise,
http://www.fhwa.dot.gov/environment/noise/measurement/mhrn03.cfm
____________________________________________________________________________________
And that’s all for now.
Jed Margolin
August 4, 2010